What is a Candlestick and How is it Used for Trading?
Table of Contents
- Introduction
- What is a Candlestick?
- How to Read a Candlestick
- Common Candlestick Patterns
- Using Candlesticks for Trading
- Tips for Effective Candlestick Trading
- Conclusion
Introduction
Candlestick charts are a fundamental tool in technical analysis, extensively used by traders to examine price movements and make informed trading decisions. These charts, which date back to Japanese rice traders in the 18th century, are popular due to their ability to visually represent market trends and price patterns clearly.
What is a Candlestick?
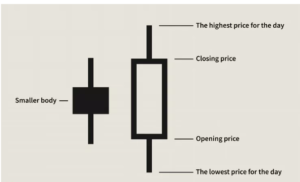
A candlestick is a visual tool that depicts price fluctuations over a designated time period, such as one minute, one hour, or one day. Each candlestick on the chart provides four key pieces of information: the opening price, the closing price, the highest price, and the lowest price during that period.
Components of a Candlestick
- Body: The rectangular part of the candlestick representing the range between the opening and closing prices.
- Bullish Candlestick (Green/White): In this case closing price of candle is higher than opening price of candle and it shows on chart with green or white color candle.
- Bearish Candlestick (Red/Black): In this case closing price of candle is lower than opening price of candle and it shows on chart with red or black color candle.
- Wicks (Shadows): The thin lines extending from the top and bottom of the body.
- Upper Wick: it shows that how much highest price attained by stock during that period.
- Lower Wick: it shows that how much lowest price attained by stock during that period.
- How to Read a Candlestick
To interpret a candlestick, one must understand the relationship between the open, high, low, and close prices within the selected time frame. This analysis assists traders in evaluating market sentiment and predicting potential future price movements.
- Long Body: It indicates whether the market is experiencing selling or buying pressure.
- Short Body: Suggests market consolidation or indecision.
- Long Wick: Reflects volatility and potential reversal points.
Common Candlestick Patterns
Candlestick patterns consist of one or more candlesticks and can indicate possible market reversals or continuations. Here are some commonly recognized patterns:
Single Candlestick Patterns
- Doji: It shows that in market neither buyers are wining nor sellers it is tie.
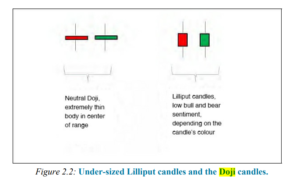
Doji candle stick pattern
- Hammer: A bullish reversal pattern characterized by a small body and a long lower wick.

- Shooting Star: A bearish reversal pattern featuring a small body and a long upper wick.

Multiple Candlestick Patterns
- Engulfing Pattern: This patterns generally shows reversal in market, in this pattern a small body candle is engulf by bigger body candle because of this its called engulfing pattern.
- Bullish Engulfing: Indicates a potential upward reversal.
Bullish engulfing candlestick - Bearish Engulfing: Indicates a potential downward reversal.
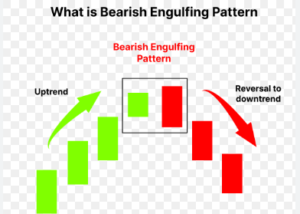
bearish engulfing pattern
- Bullish Engulfing: Indicates a potential upward reversal.
- Morning Star: A bullish reversal pattern formed by three candles: a long bearish candle, a small indecisive candle, and a long bullish candle.
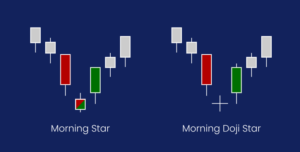
Morning star pattern - Evening Star: A bearish reversal pattern formed by three candles: a long bullish candle, a small indecisive candle, and a long bearish candle.
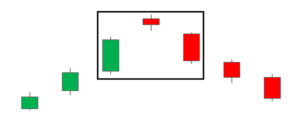
Evening star pattern
Using Candlesticks for Trading
Traders use candlestick patterns to inform their trading decisions in various ways:
- Identifying Trends: Candlestick patterns help traders recognize current market trends and potential reversals.
- Confirming Signals: Candlesticks are often used alongside other technical indicators to validate trading signals.
- Setting Entry and Exit Points: Recognizing patterns can assist traders in determining optimal entry and exit points for trades.
Tips for Effective Candlestick Trading
- Combine with Other Indicators: Enhance the reliability of signals by using candlestick patterns with other technical indicators like Moving Averages, RSI, and MACD.
- Consider Market Context: Always consider the broader market context and avoid making decisions based solely on candlestick patterns.
Practice and Familiarity: Familiarize yourself with different patterns and practice identifying them in real-time market conditions.
Conclusion
Candlestick charts are a powerful tool for traders, providing insights into market dynamics through simple, visual patterns. By mastering candlestick patterns and integrating them into a broader trading strategy, traders can make more informed and potentially more profitable decisions. Happy trading!

